
Gray maps are often overlooked in image optimization. Fifty may be an exaggeration but the gray maps will add other levels of gray to the factory presets already in your machine. We will not go into Tint maps here. That will be the subject of another article. How are gray maps put together? How do they affect your image? These are two areas that will be discussed in this article. This is not the same thing as gray scale ratio.
Why do we need gray maps? The answer is that we need all forms of image optimization to produce excellent images for accurate diagnoses. Sometimes the out of the box presets may not have the look that is desired by the customer. Some customers may tell you they want the images to look like one machine or the other machine. We have been very successful in fine tuning image appearance to please the customer.
Grayscale is just the many shades of gray that a standard 2D image is capable of displaying. There are several parameters that affect that overall appearance. Gain is the most familiar because you adjust that with almost every image. Then there are the TGC settings and they adjust the image based on horizontal band. Dynamic range is also used to adjust the appearance. Gray maps and Dynamic range are not the same thing and they are not formed the same way.
Gray maps are formed by several complex processes. Spatial dithering is one of those concepts. Most sonographers are never taught this concept in their physics training. To simplify spatial dithering: takes into account the scan conversion time, frame rate, the intensity of pixels and quantization. A dither is the ability of the conversion to map black and white or colors in binary terms while mapping two variables. This is applied to a bit at a time. This uses nearest pixel information to further convert levels of black and white into multiple shades of gray. Remember that most modern ultrasound systems layer their bit configurations so now you have this conversion taking place on several layers at the same time using a complex binary code. These specific codes and the type of conversions and mapping are patented by each manufacturer so they are unique.
Beamformers are heavily involved with this process also. Many times part of this specific conversion takes place on another type of board as it is being processed by the beamformer. These pathways work together and happen in less than a nanosecond.
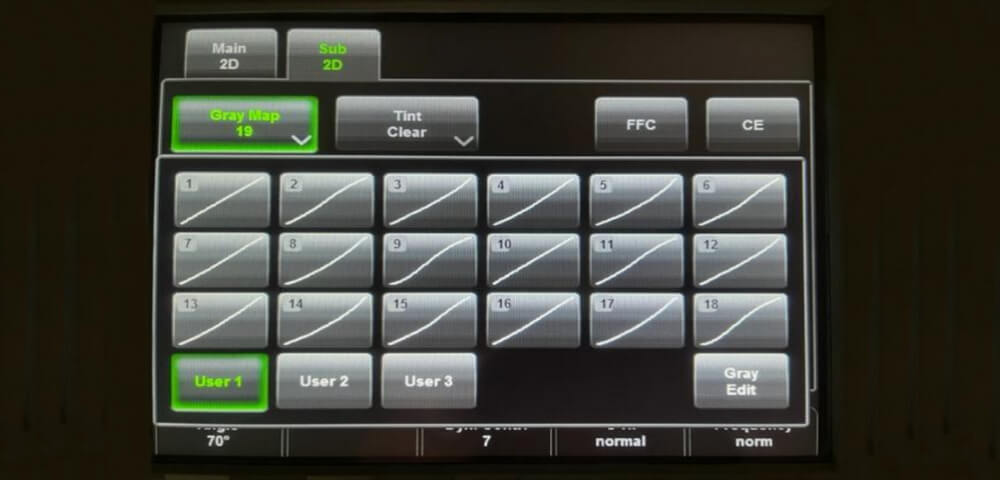
This is the best visual idea of what is mentioned above. So imagine that each rectangle has several layers under it. All the dithering and scan conversions have been completed and stored into twenty one different maps for you to use and customize your images.
If you look at the lines inside the rectangles you see that they have different curves. Again these curves do not relate to the TGC curve. The top edge of the rectangle corresponds to the top part of the scan screen or sector screen. The bottom edge of the rectangle is at the bottom or widest part of the scan screen or scan area. The reason some are curved with emphasis on the top or bottom part is that it will add consistency to that part of your screen over the course of many frames. Likewise an upward curve or downward curve in the middle adds brightness and detail to the middle part of the scan area. These maps are produced in a way that has to be perceptible to the human eye. More shades of gray will add clarity and increase resolution. This only applies to digital images.
How do you set the gray map? This is something that is done with your applications specialist because they are accustomed to looking at and have been trained in this area. Most customers know what they like and want to have it look a certain way. The first step is to scan different patients with the standard preset in order to determine if anything needs to be changed. Then hold all other things the same so that the only thing you are changing is the gray map. Once this mystery has been solved then you can start changing other parameters. Then either create a custom label and or preset to hold the changes in the machine permanently.
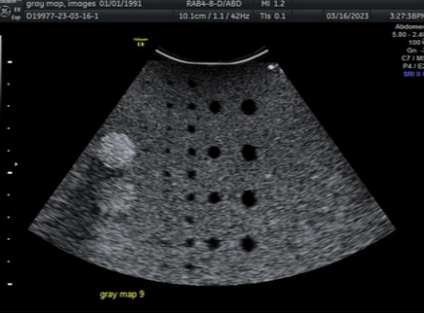
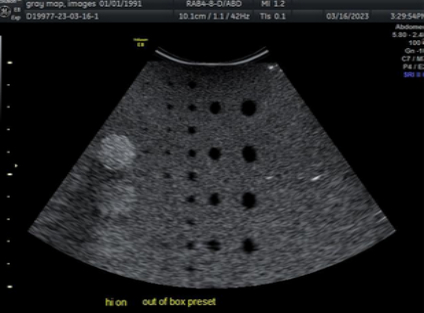
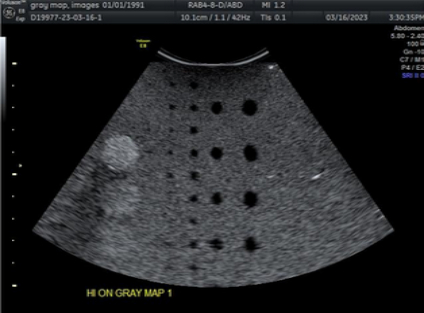
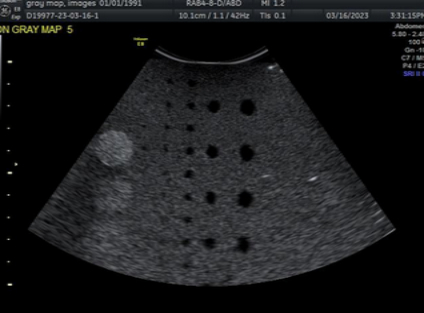
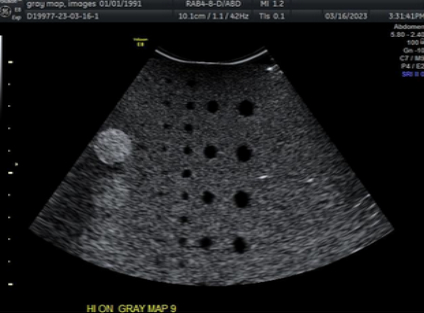
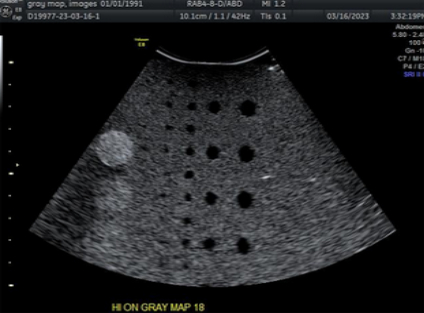
In the below images the dynamic range, TGC and gain never changed. The persistence, SRI or CRI did not change. The parameter that changed was harmonics on or off. When we switched to harmonics the gain automatically changed to -10.
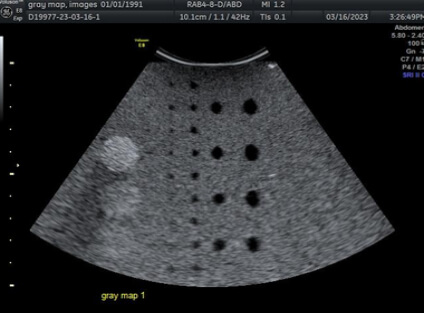
Harmonics off
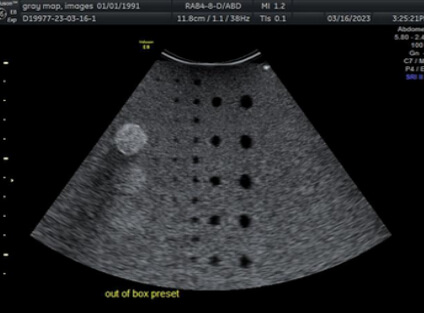
Harmonics off
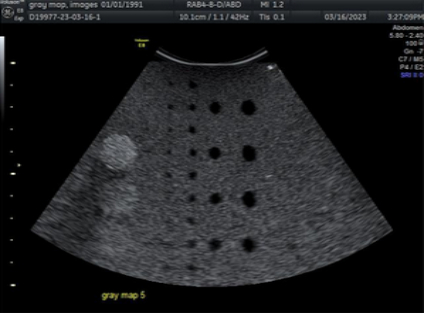
Harmonics off
Harmonics off

Harmonics off
The straighter the curve the more overall change to your image. The others have subtle changes to the near or far fields. Other maps change the shade of gray altogether. Many manufacturers do not show these rectangles. The vast majority of times the gray maps are listed as numbers or letters and you will need to look at all of them carefully to see which ones are the best to use.
If you have any questions about any of our machines please call 843-566-1020.
References (Not in AMA format as this is not a term paper)
- United States Patent Office Application 2011, Siemens Medical Corporation
Inventor: Dr. Todd D. Willsie of Seattle, Washington Date of Patent August 30, 2011 - International Atomic Energy Agency, Author: J.C. Lacefield, Chapter 13 Ultrasound imaging, Diagnostic Radiology Physics: A handbook for Teachers and Students, ISBN 978-92-0-131010-1
- Ultrasound Scan Conversion with Spatial Dithering, First published 12/23/1997 and subsequent update have been published through 1998,
Inventors: Jeffery Gilbert, Alice M. Chiang and Steven R. Broadstone,Published through Google patent search WO1998028631A2.